Rescaled frequency maps

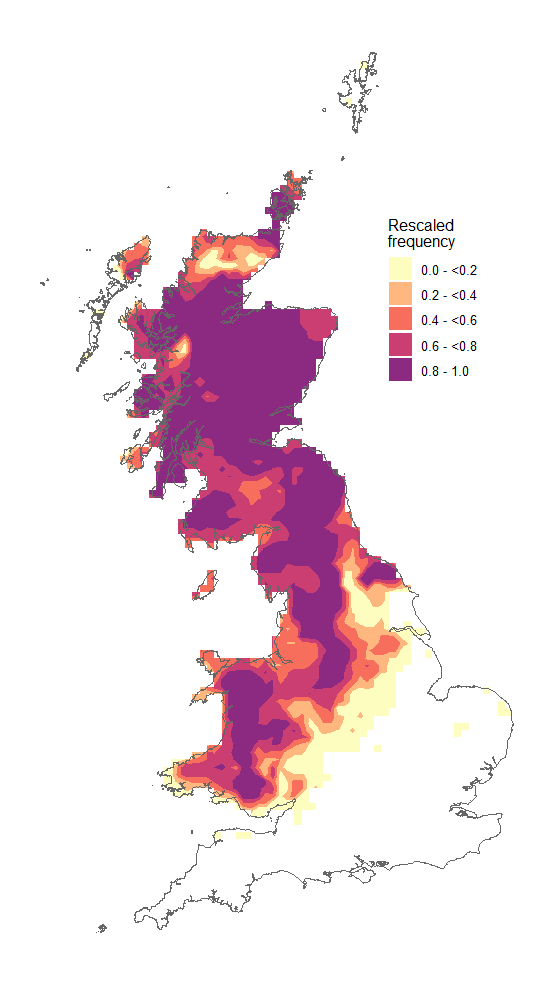
This example map shows the rescaled frequency calculated for each hectad for all records, from 1980 to present, for Chrysotoxum arcuatum . The rescaled frequency calculated by Frescalo has values in the range 0-1. In this map, the results are contoured into five steps of width 0.2.
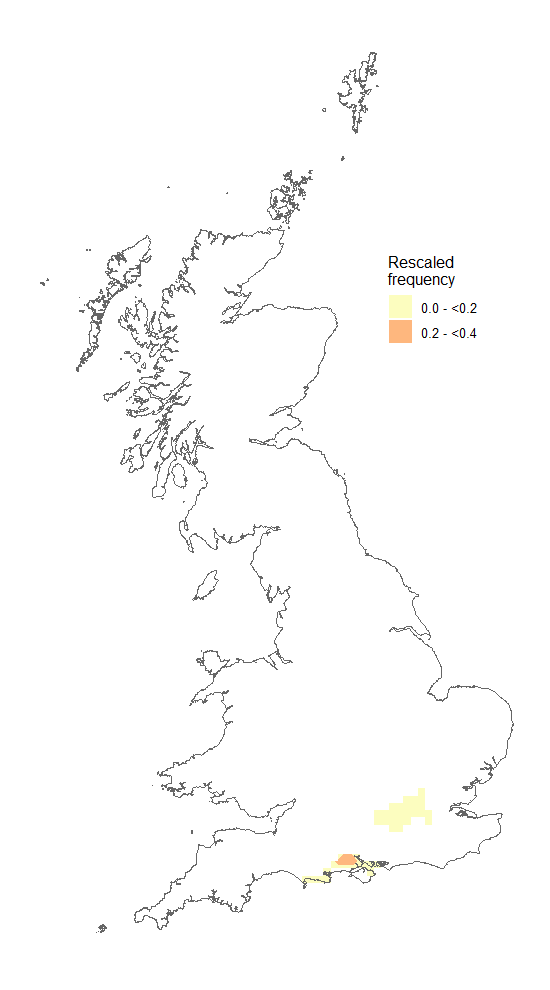
We have generally found that this technique produces quite compelling results that fit well with field experience. They do a good job of "filling in the gaps" that result from the rather patchy recording available to the Recording Scheme and give a good, overall impression of the range of a species over the last 50 years. However, they do not work well for rare species recorded from only a few hectads, or for outlying hectads from the main distribution of more widespread species. For example, consider this map for Caliprobola speciosa.

At the time of writing, this species is known only from two small areas, but, due to the neighbourhood weighting method employed by Frascalo, these two patches get smeared over the neighbourhoods of these hectads in a manner related to the neighbourhood weights. This gives the impression of a wider distribution which has no real basis. Consequently, a bit of caution is needed in relation to the maps for very rare species or when assessing outlying points beyond the main distribution.